Skip to content
CarReliabilityRankings.com
Menu

Honda Fit Reliability Rankings: Years to Avoid and Best Years to Buy

NHTSA data as of Oct 15, 2026Published Oct 23, 2026

According to our reliability score system, the best Honda Fit years to buy are the 2013, 2016, 2017 and 2020. The 2017 scores highest, at 88 out of 100.

No Fit year rates Avoid, but the 2007 needs a careful look. Owners of the 2007 most often report the steering, mostly working only some of the time.

Shopping for a newer Fit? Among the 2009 and later years, the 2009 to 2013 and 2015 to 2020 rate Good or Excellent.

On a tighter budget, an older Fit from before 2009 can be a smart buy. The 2008 rates Good. Skip or check closely the 2007.

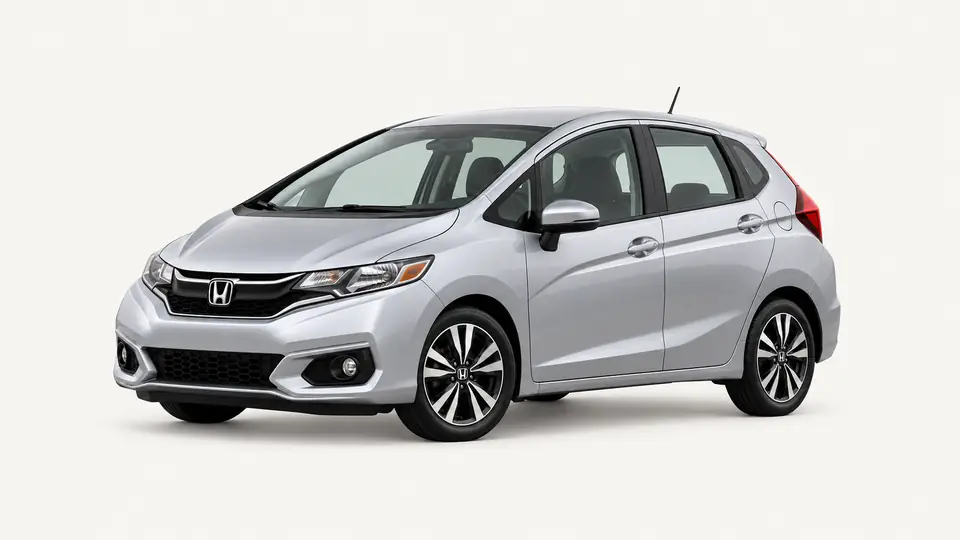
Honda Fit, 3rd generation (2015–2020)
76
Good
Model score, all years
13
Model years tracked
2,198
Owner complaints
34
Recalls, all years
Caution1 year
Avoid0 years

No Fit year is rated Avoid.

Honda Fit reliability score by model yearScore out of 100 · 70 = average for a car of the same age
06070801002007: 64.3 (Caution)64'072008: 72.0 (Good)72'082009: 75.8 (Good)76'092010: 73.9 (Good)74'102011: 74.8 (Good)75'112012: 77.6 (Good)78'122013: 81.0 (Excellent)81'132015: 74.3 (Good)74'152016: 85.6 (Excellent)86'162017: 88.0 (Excellent)88'172018: 72.9 (Good)73'182019: 72.9 (Good)73'192020: 81.8 (Excellent)82'20
Excellent 80+Good 70–79Caution 60–69Avoid under 60 Provisional, with 80% range 70 = average for a car of the same age

Best Years to Buy a Honda Fit

Four Fit years rate Excellent, scoring 80 or higher. The 2017 leads with 88.

Honda Fit, 3rd generation (2015–2020)

2017 Fit

3rd generation

88
Excellent

Most reported problems

  • Instrument cluster: works on and off16%
  • Engine: unusual noises14%
  • Paint and rust: damage14%
  • Fuel injector: fault code9%
  • VTC actuator failure5%
  • Fuel economy: high fuel use5%
Per 10k cars
10.6
Complaints
43
Recalls
0
Full 2017 report →
Honda Fit, 3rd generation (2015–2020)

2016 Fit

3rd generation

86
Excellent

Most reported problems

  • Instrument cluster: works on and off36%
  • Fuel injector failure12%
  • Tires: parts breaking or coming apart7%
  • Body seals (water leak): water leaking in6%
  • Tire pressure monitoring: warning lights4%
  • Unintended acceleration (cause not stated)3%
Per 10k cars
16.8
Complaints
121
Recalls
1
Full 2016 report →
Honda Fit, 3rd generation (2015–2020)

2020 Fit

3rd generation

82
Excellent

Most reported problems

  • Instrument cluster: works on and off19%
  • Engine carbon buildup: rough running or misfires14%
  • Automatic emergency braking: hard braking with nothing ahead11%
  • Driver-assist camera and radar: stopped working11%
  • Rear window glass: shattering or cracking8%
  • Fuel system: a bad smell6%
Per 10k cars
10.3
Complaints
36
Recalls
4
Full 2020 report →
Honda Fit, 2nd generation (2009–2013)

2013 Fit

2nd generation

81
Excellent

Most reported problems

  • CV axles: parts breaking or coming apart6%
  • Ignition coils or spark plugs: damage5%
  • Steering: locking up4%
  • Electrical system (part not stated): works on and off3%
  • Unintended acceleration (cause not stated)3%
  • 12V battery: the car not starting3%
Per 10k cars
12.5
Complaints
176
Recalls
10
Full 2013 report →

Also rated Good: 2008–2012, 2015, 2018–2019.

Honda Fit Years to Avoid

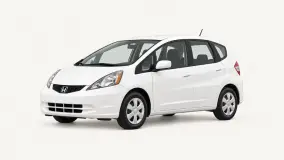
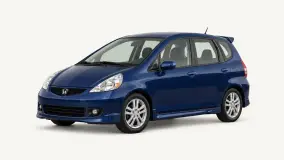
No Fit year rates Avoid. The 2007 is the only Fit year rated Caution, with a score of 64.

Honda Fit, 1st generation (2007–2008)

2007 Fit

1st generation

64
Caution

Most reported problems

  • Steering: works on and off22%
  • Headlights: stopped working17%
  • Body seals (water leak): water leaking in13%
  • CV axles: parts breaking or coming apart4%
  • Exterior lights: stopped working3%
  • Cabin odor or mold: a bad smell3%
Per 10k cars
47.4
Complaints
370
Recalls
11

Honda extended the warranty on some 2007 Fits for a problem with the steering.

Full 2007 report →

Honda Fit Reliability by Year

All model years, newest first. Tap a year for its full report, with the problems owners report, recalls, Honda programs and crash ratings.

YearGenerationRatingScoreVs averageComplaintsPer 10k carsRecalls
20203rd generationExcellent820.38×3610.34Report
20193rd generationGood730.84×13623.96Report
20183rd generationGood730.84×11729.54Report
20173rd generationExcellent880.31×4310.60Report
20163rd generationExcellent860.46×12116.81Report
20153rd generationGood740.88×28532.74Report
20132nd generationExcellent810.36×17612.510Report
20122nd generationGood780.53×11316.311Report
20112nd generationGood750.49×11315.111Report
20102nd generationGood740.49×18416.812Report
20092nd generation(first year)Good760.70×28724.511Report
20081st generationGood720.73×21723.48Report
20071st generationCaution641.3×37047.411Report

Vs average: how this year's complaint rate compares with the average car of the same age. 1× is average, 2× is twice as many. Per 10k cars: complaints so far for every 10,000 cars Honda made for the U.S. that model year. The complaint count also includes owners who wrote in only about a recall notice, with no problem to report. The score leaves those out. Generations follow Honda's own model history.

How We Score Each Model Year

1

Count What Owners Report

Every complaint filed with NHTSA for the model year, plus its recalls. Recall-notice filings with no fault are left out.

2

Adjust for How Many Were Made

A popular car gets more complaints just because there are more of them. We divide by the number Honda made for that model year and compare with the average car of the same age.

3

Turn It Into a Score

70 is average. Twice the average rate of complaints costs 10 points, half the rate adds 10. Serious problems count more than everyday ones.

Read the full method →

What to Do Next