
Skip to content
CarReliabilityRankings.com
Menu

Audi Q5 Reliability Rankings: Years to Avoid and Best Years to Buy

NHTSA data as of Oct 15, 2026Published Oct 19, 2026

According to our reliability score system, the best Audi Q5 year to buy is the 2017, at 81 out of 100.

No Q5 year rates Avoid, but the 2021 needs a careful look. Owners of the 2021 most often report the control module.

Want something recent? Of the Q5s from 2018 on, the 2018 to 2020 and 2022 to 2024 rate Good. Watch out for the 2021. The 2025 and 2026 are too new for a final score.

Looking at older Q5s, from before 2018? The 2009 to 2017 rate Good or Excellent.

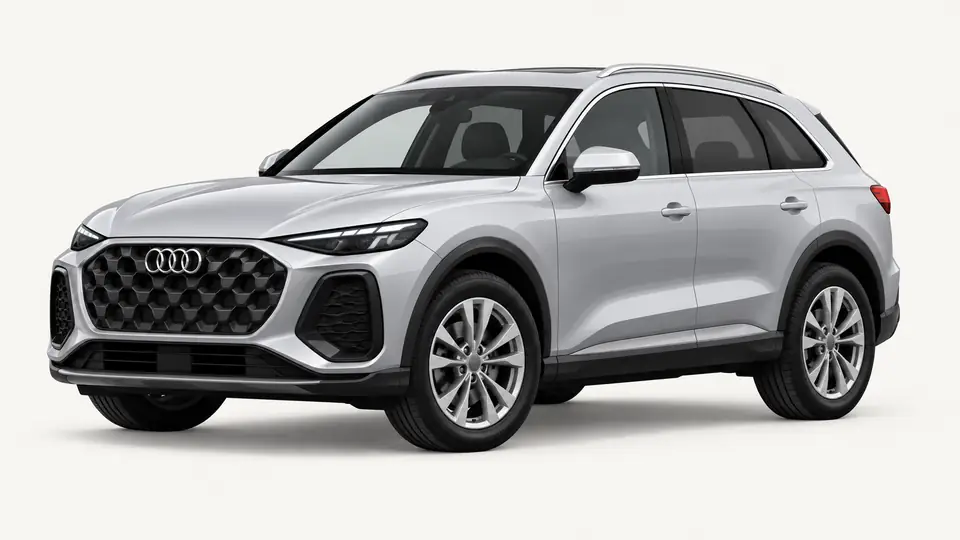
Audi Q5, 3rd generation (2026)
74
Good
Model score, all years
18
Model years tracked
1,567
Owner complaints
37
Recalls, all years
Excellent1 year
Caution1 year
Avoid0 years

No Q5 year is rated Avoid.

Not rated yet: 2025, 2026, too new for a final score.

Audi Q5 reliability score by model yearScore out of 100 · 70 = average for a car of the same age
06070801002009: 73.6 (Good)74'092010: 73.2 (Good)73'102011: 69.6 (Good)70'112012: 69.6 (Good)70'122013: 74.0 (Good)74'132014: 70.7 (Good)71'142015: 73.9 (Good)74'152016: 78.5 (Good)78'162017: 80.8 (Excellent)81'172018: 72.5 (Good)73'182019: 77.1 (Good)77'192020: 77.7 (Good)78'202021: 67.6 (Caution)68'212022: 74.6 (Good)75'222023: 74.4 (Good)74'232024: 72.5 (Good)73'242025: provisional 64, range 61 to 68~64'252026: not scored yetnew'26
Excellent 80+Good 70–79Caution 60–69Avoid under 60 Provisional, with 80% range 70 = average for a car of the same age

Best Years to Buy an Audi Q5

The 2017 is the only Q5 year rated Excellent, with a score of 81.

Audi Q5, 1st generation (2009–2017)

2017 Q5

1st generation

81
Excellent

Most reported problems

  • Cooling system: a leak17%
  • Steering: stopped working11%
  • Unintended acceleration (cause not stated)9%
  • Airbags: no deployment in a crash6%
  • Engine oil consumption: burning or using oil6%
  • Brakes: locking up4%
Per 10k cars
10.7
Complaints
47
Recalls
5
Full 2017 report →

Also rated Good: 2009–2016, 2018–2020, 2022–2024.

Audi Q5 Years to Avoid

No Q5 year rates Avoid. The 2021 is the only Q5 year rated Caution, with a score of 68.

Audi Q5, 2nd generation (2018–2025)

2021 Q5

2nd generation

68
Caution

Most reported problems

  • Control module (unspecified) failure25%
  • Automatic emergency braking: hard braking with nothing ahead9%
  • Engine failure7%
  • Cooling system: a leak6%
  • Sunroof glass (shattered): shattering or cracking5%
  • Transmission: failure or loss of drive5%
Per 10k cars
18.2
Complaints
116
Recalls
8

Audi extended the warranty on some 2021 Q5s for problems with the air conditioning, fuel system and driver assistance systems.

Full 2021 report →

The Newest Q5 Years: 2025–2026

A final score needs 36 months of complaints. Until then we show what we know, and a provisional reading once there is enough data.

Audi Q5, 2nd generation (2018–2025)

2025 Q5

Provisional

Provisional score 64 (likely 61 to 68), in the middle third of 2025 models so far. Final score at 36 months.

Same generation as the 2024, which scored 73 (Good).

What we know so far →
Audi Q5, 3rd generation (2026)

2026 Q5

Too new

8 complaints and 0 recalls so far. First provisional score expected around July 2027.

What we know so far →

Audi Q5 Reliability by Year

All model years, newest first. Tap a year for its full report, with the problems owners report, recalls, Audi programs and crash ratings.

YearGenerationRatingScoreVs averageComplaintsPer 10k carsRecalls
20263rd generation(first year)Too new––820.80Report
20252nd generationProvisional 64––538.01Report
20242nd generationGood730.76×405.44Report
20232nd generationGood740.75×607.26Report
20222nd generationGood750.77×518.69Report
20212nd generationCaution681.2×11618.28Report
20202nd generationGood780.54×459.56Report
20192nd generationGood770.50×7211.55Report
20182nd generation(first year)Good730.80×23220.16DNDReport
20171st generationExcellent810.36×4710.75Report
20161st generationGood780.44×8313.05Report
20151st generationGood740.58×10819.27Report
20141st generationGood710.80×11826.56Report
20131st generationGood740.82×9230.85Report
20121st generationGood700.72×16828.66Report
20111st generationGood701.0×14338.45Report
20101st generationGood730.77×10033.84Report
20091st generationGood740.68×3129.26Report

Vs average: how this year's complaint rate compares with the average car of the same age. 1× is average, 2× is twice as many. Per 10k cars: complaints so far for every 10,000 cars Audi made for the U.S. that model year. The complaint count also includes owners who wrote in only about a recall notice, with no problem to report. The score leaves those out. Generations follow Audi's own model history.

How We Score Each Model Year

1

Count What Owners Report

Every complaint filed with NHTSA for the model year, plus its recalls. Recall-notice filings with no fault are left out.

2

Adjust for How Many Were Made

A popular car gets more complaints just because there are more of them. We divide by the number Audi made for that model year and compare with the average car of the same age.

3

Turn It Into a Score

70 is average. Twice the average rate of complaints costs 10 points, half the rate adds 10. Serious problems count more than everyday ones.

Read the full method →

What to Do Next