
2008 TT
2nd generation (8J)
Good
Most reported problems
- Dual-clutch transmission: harsh or delayed shifts29%
- Taillights or brake lights: damage14%
- Per 10k cars
- 17.8
- Complaints
- 14
- Recalls
- 2
NHTSA data as of Oct 15, 2026Published Oct 19, 2026
According to our reliability score system, the best Audi TT years to buy are the 2003, 2005 and 2008. The 2008 scores highest, at 79 out of 100.
No TT year rates Avoid, but the 2000, 2004 and 2009 need a careful look. Owners of the 2000 most often report the instrument cluster, mostly not working. On the 2004 and 2009, the main complaint is the dual-clutch transmission, mostly losing drive.
Want something recent? Of the TTs from 2008 on, the 2008 and 2016 rate Good. Watch out for the 2009. The 2010 to 2015 and 2017 to 2023 have too little data to score.
Looking at older TTs, from before 2008? The 2002, 2003 and 2005 rate Good. Think twice about the 2000, 2001 and 2004. The 2006 has too little data to score.
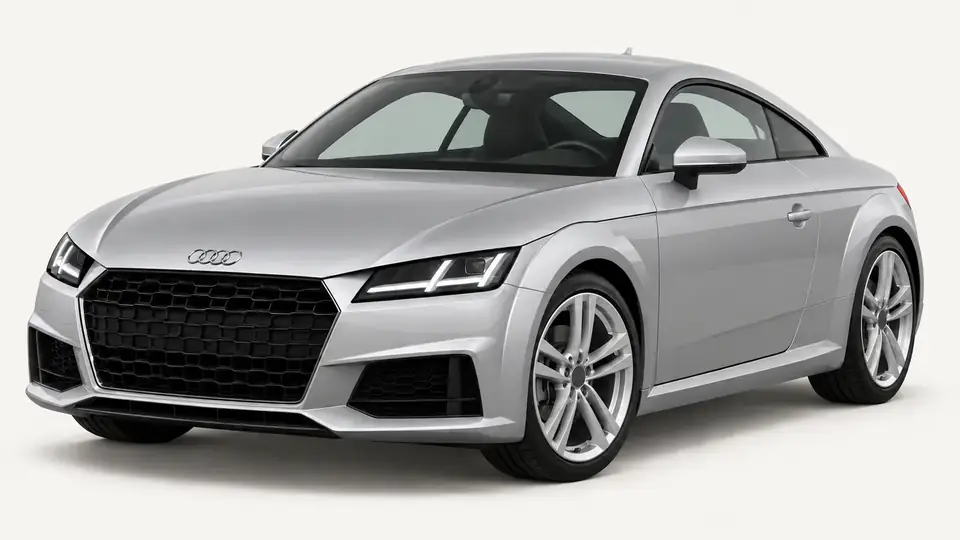
No TT year reaches 80, our Excellent line. These three score highest, all rated Good, led by the 2008 at 79.
2nd generation (8J)
Most reported problems

1st generation (8N)
Most reported problems
1st generation (8N)
Most reported problems
Also rated Excellent or Good: 2002, 2016.
No TT year rates Avoid. These four rate Caution, the lowest scores of all TT years.
1st generation (8N)
Most reported problems
1st generation (8N)
Most reported problems
1st generation (8N)
Most reported problems
2nd generation (8J)
Most reported problems
Audi extended the warranty on some 2009 TTs for problems with the engine.
Full 2009 report →All model years, newest first. Tap a year for its full report, with the problems owners report, recalls, Audi programs and crash ratings.
| Year | Generation | Rating | Score | Vs average | Complaints | Per 10k cars | Recalls | |
|---|---|---|---|---|---|---|---|---|
| 2023 | 3rd generation (8S) | Not enough data | – | – | 0 | 0.0 | 1 | Report |
| 2022 | 3rd generation (8S) | Not enough data | – | – | 0 | 0.0 | 0 | Report |
| 2021 | 3rd generation (8S) | Not enough data | – | – | 0 | 0.0 | 0 | Report |
| 2020 | 3rd generation (8S) | Not enough data | – | – | 0 | 0.0 | 0 | Report |
| 2019 | 3rd generation (8S) | Not enough data | – | – | 0 | 0.0 | 1 | Report |
| 2018 | 3rd generation (8S) | Not enough data | – | – | 3 | 14.2 | 2 | Report |
| 2017 | 3rd generation (8S) | Not enough data | – | – | 0 | 0.0 | 3 | Report |
| 2016 | 3rd generation (8S)(first year) | Good | 76 | 0.64× | 6 | 17.1 | 4 | Report |
| 2015 | 2nd generation (8J) | Not enough data | – | – | 0 | 0.0 | 0 | Report |
| 2014 | 2nd generation (8J) | Not enough data | – | – | 0 | 0.0 | 0 | Report |
| 2013 | 2nd generation (8J) | Not enough data | – | – | 3 | 13.7 | 0 | Report |
| 2012 | 2nd generation (8J) | Not enough data | – | – | 1 | 4.4 | 0 | Report |
| 2011 | 2nd generation (8J) | Not enough data | – | – | 1 | 7.0 | 0 | Report |
| 2010 | 2nd generation (8J) | Not enough data | – | – | 4 | 33.3 | 1 | Report |
| 2009 | 2nd generation (8J) | Caution | 68 | 1.3× | 13 | 40.5 | 2 | Report |
| 2008 | 2nd generation (8J) | Good | 79 | 0.51× | 14 | 17.8 | 2 | Report |
| 2006 | 1st generation (8N) | Not enough data | – | – | 4 | 33.7 | 0 | Report |
| 2005 | 1st generation (8N) | Good | 76 | 0.74× | 11 | 32.7 | 0 | Report |
| 2004 | 1st generation (8N) | Caution | 67 | 1.5× | 25 | 40.9 | 1 | Report |
| 2003 | 1st generation (8N) | Good | 77 | 0.67× | 13 | 21.2 | 0 | Report |
| 2002 | 1st generation (8N) | Good | 74 | 0.85× | 38 | 33.2 | 0 | Report |
| 2001 | 1st generation (8N) | Caution | 67 | 1.3× | 120 | 54.2 | 3 | Report |
| 2000 | 1st generation (8N) | Caution | 61 | 2.0× | 73 | 89.4 | 5 | Report |
Vs average: how this year's complaint rate compares with the average car of the same age. 1× is average, 2× is twice as many. Per 10k cars: complaints so far for every 10,000 cars Audi made for the U.S. that model year. The complaint count also includes owners who wrote in only about a recall notice, with no problem to report. The score leaves those out. Generations follow Audi's own model history.
Every complaint filed with NHTSA for the model year, plus its recalls. Recall-notice filings with no fault are left out.
A popular car gets more complaints just because there are more of them. We divide by the number Audi made for that model year and compare with the average car of the same age.
70 is average. Twice the average rate of complaints costs 10 points, half the rate adds 10. Serious problems count more than everyday ones.